Consumption App - Copy this React, Tailwind Component to your project
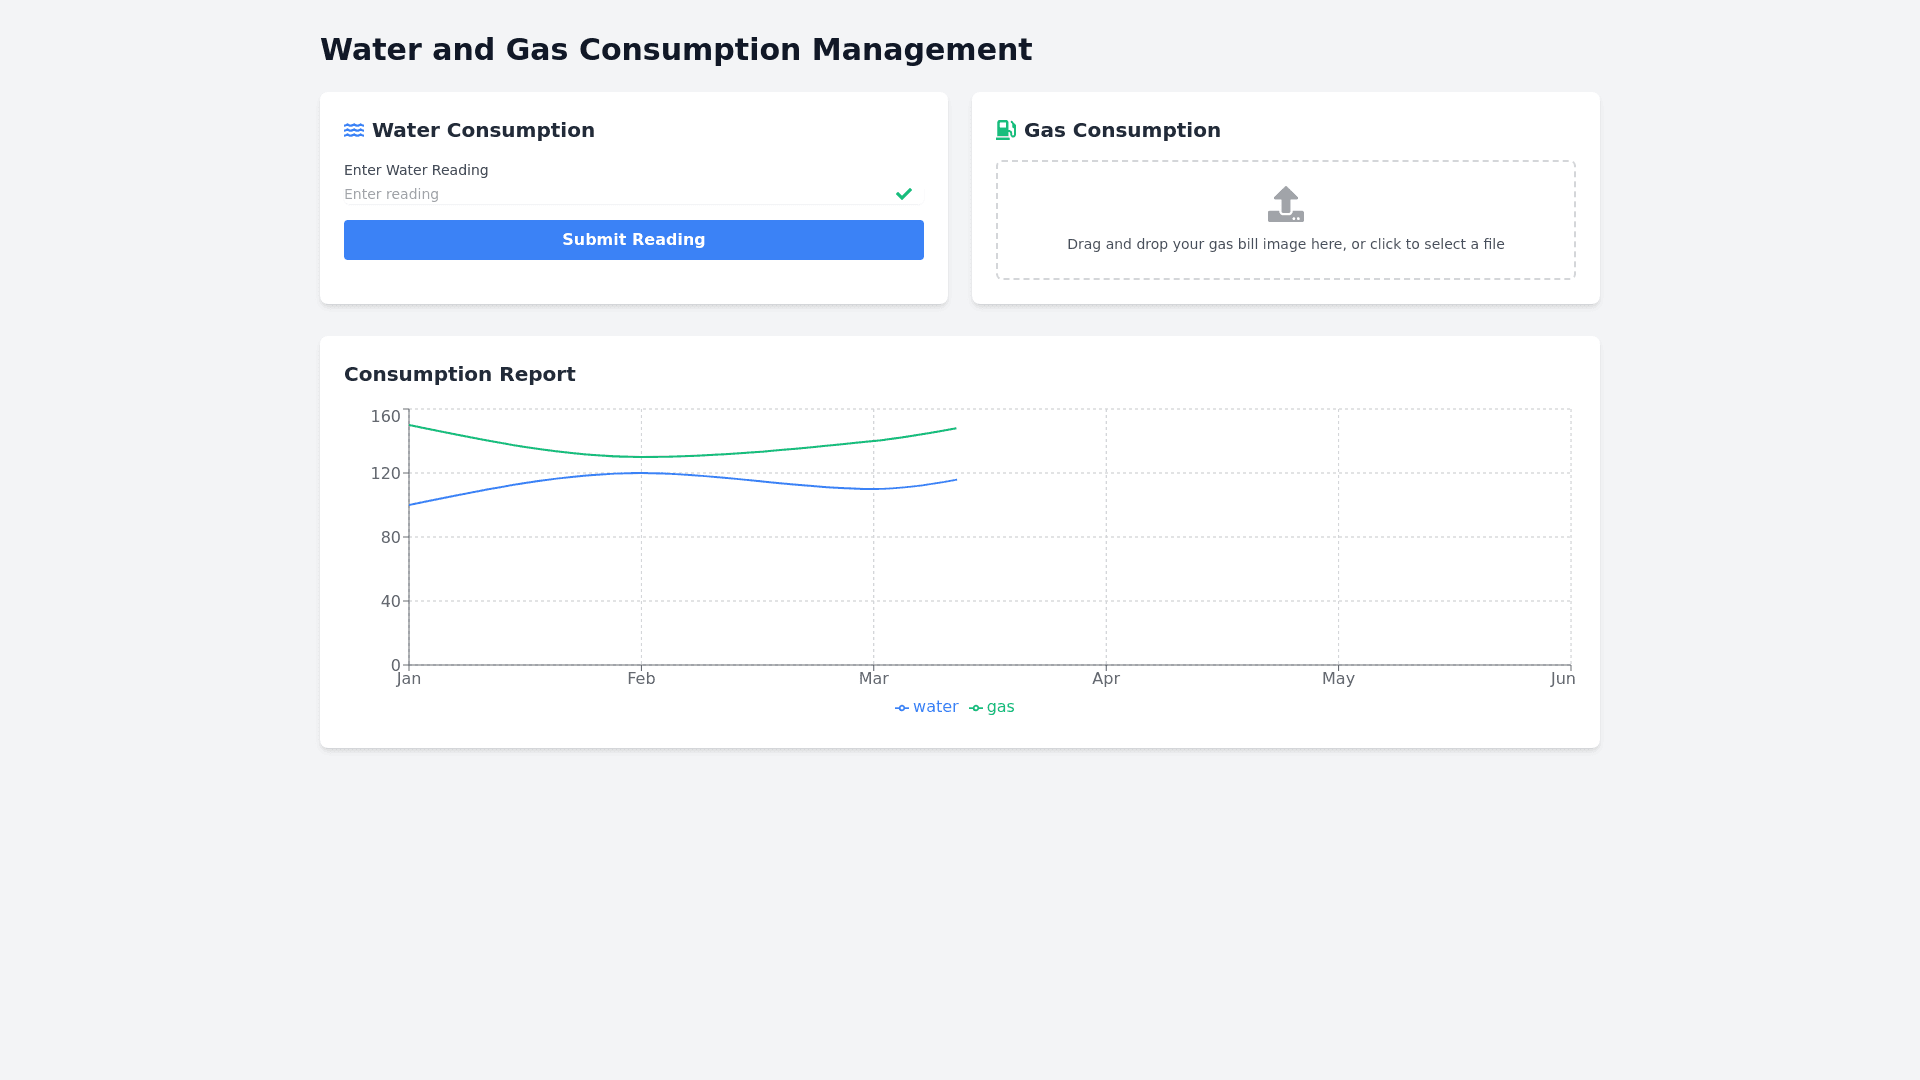
I want you to create a layout for the frontend of a water and gas consumption reading management application that is modern, intuitive, and easy to use. The design should be responsive to work well on both mobile devices and desktops. Here are the specific requirements: Login and Registration Page: Login: Fields for email and password, with a "Remember me" option. A link to recover the password. Registration: Fields for full name, email, password, and password confirmation. A clear and highlighted button for registration. Style: Simple and clean, with a subtle background and friendly icons. It should include visual feedback elements, such as red borders for invalid inputs. Customer Dashboard: Overview: Display a summary of the most recent readings and total water and gas consumption. Upload Button: A prominent button for the customer to upload images of the meters. It should include a drag and drop area for more intuitive uploads. Recent Readings: A list or table of the most recent readings, with dates, reading types (water or gas), and status (confirmed or unconfirmed). Style: Use charts and icons to illustrate consumption. Utilize soft and neutral colors with highlights in blue and green for water and gas, respectively. Reading Upload Page: Upload Area: A centered area to upload images of the meters, with clear instructions and a camera icon. Image Preview: After the upload, show a preview of the image and a button to confirm or redo the upload. Style: Full screen view with centered elements. Use a color palette that makes reading easy. Reading Confirmation Page: Readings List: Display a detailed list of readings pending confirmation, with the meter image next to the recognized value. Action Buttons: Buttons to confirm or reject the reading. Provide immediate visual feedback (such as changing color or a confirmation icon) upon confirming or rejecting. Style: Layout organized in cards for each reading, with adequate spacing to avoid information overload. Reports Page: Consumption Reports: Show line and bar charts that illustrate water and gas consumption over time. Filters: Options to filter by date, reading type, and confirmation status. Export: A button to export reports in PDF or CSV. Style: Use interactive charts that allow zooming and time range selection. Include a clear and easy to read legend.